New research on mobile behavior released today points to the growing struggle that app businesses face in establishing themselves as a must-have download on users’ smartphones. Today’s consumers are spending over 85 percent of their time on their smartphones using native applications, but the majority of their time – 84 percent – is spent using just five non-native apps they’ve installed from the App Store.
Those five apps will vary from person to person. For some, their top five could include social media or gaming, while others may spend more time in instant messaging.
This data further supports a study Nielsen released earlier this month which also reiterated that there does appear to be an upper limit to how many apps consumers use on a monthly basis. While this new study from Forrester Research examines where consumers spent the majority of their time, Nielsen’s report noted that users would only use 26 to 27 apps per month in total.
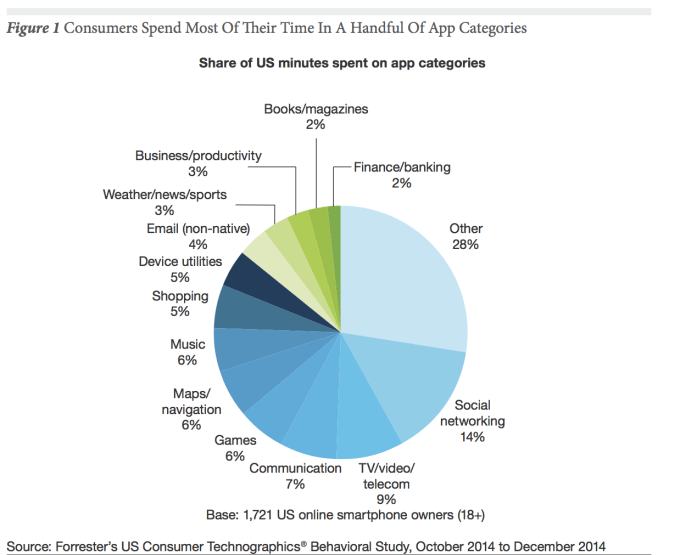
The new data on app usage comes from a Forrester Research study that analyzed 2,000 U.S. smartphone owners to better determine how users engage with the apps they have on their phones. According to the findings, communication and social apps account for the most usage – with a combined 21 percent of all smartphone minutes. Text messaging and voice calls were not counted, but would add to this total if they had been.
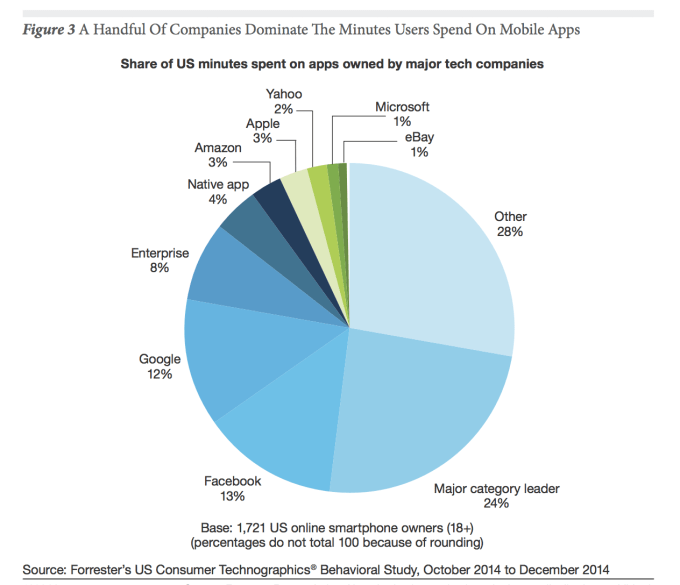
This trend also means that a small handful of companies are now dominating app usage. Facebook, for example, accounts for 13 percent of U.S. minutes spent on apps, followed closely by Google at 12 percent. Other big-name tech companies also see heavy usage, including Amazon (3 percent), Apple (3 percent), Yahoo (2 percent), Microsoft (1 percent) and eBay (1 percent.)
As a category, social networks claim 14 percent of all smartphone usage – or more than 25 minutes per day. Facebook is the leader here, with 1.25 billion mobile monthly active users.

[Note on the above chart: the large grouping referred to as “major category leader” includes the other leading apps that do not fall within the 6 companies evaluated for the research, such as Twitter, Firefox, The Weather Channel, etc.]
Meanwhile, U.S. users spend 4.8 percent of their smartphone minutes in instant messaging apps like WhatsApp, but globally, this figure is even higher. Worldwide, apps like WeChat, KakaoTalk, Line and others are seeing users spending 50 to 200 minutes with them per week. In the U.S., however, the phone’s native messaging application sees higher usage than IM’ing apps, accounting for 8 percent of minutes spent on smartphones.
Media is another popular category of apps with weather, news and sports accounting for 3 percent of all usage minutes. News leads here with a median of 11 minutes, 51 seconds per day. Mobile users’ interest and heavy use of news apps is likely why Apple decided to enter the space itself with the launch of the forthcoming “News” app which will be installed by default with iOS 9.

Games and Music account for 6 percent of smartphone usage minutes, while streaming video represents 9 percent of minutes. Here, YouTube leads with 43 percent adoption, but Netflix has the highest median use at 31 minutes, 33 seconds. Books and magazines represent 2 percent of smartphone usage minutes, which is actually fairly high given their long-form nature. Other categories like Shopping (5 percent), Maps/Navigation (6 percent), Email (non-native, 4 percent), Productivity (3 percent) are also popular.
Based on this data and other findings in the new report, Forrester advises businesses to design their apps only for their best and most loyal or frequent customers – because those are the only one who will bother to download, configure and use the application regularly. For instance, most retailers say their mobile web sales outweigh their app sales, the report says. Meanwhile, outside of these larger players, many customers will use mobile websites instead of a business’ native app

Comments
Post a Comment